Effect of conditioning on cotton yarn properties
During
the production of yarn, cotton and other fibers experienced a range of
mechanical processes. In its phases of operation at blow room, card,
draw frame, flyer frame and ring frame, these places can be subjected to
change from one department to other in order to receive optimum
production efficiency and lowest waste.
A study reveals that for a range or relative humidity from 25 percent to 65 percent and a frequent temperature of 25 degree Celsius, the roller-lapping drift changes. Higher lapping frequency, particularly at 65 percent RH is received due to higher relative humidity. Lower rates of lapping could be noted for pure cotton up to 50 percent RH and beyond that there is larger frequency of lapping observed with increase in relative humidity.
Larger value of lapping was noted even at RH as low as 35 percent for P/C blends. Likewise, it is necessary to keep proper atmospheric conditions in a card room. A small amount of relative humidity may produce regular web breakages, tremendous fly releases and lapping on the doffer. A large amount of relative humidity should also be neglected as it directs to sagging of web and loading of licker-in and cylinder.
For mixing room, the suggested RH percentage is 60-65 percent, for blow room, card, and draw frame and speed frame department it kept at 50-55 percent, for ring spinning it kept at 50-60 percent and for winding department it kept at 60-65 percent. As cotton is a hydrophilic fiber, it dries up due to the existence of a lesser amount of moisture in the air in poorer relative humidity than standard atmospheric form and also the yarn quality gets influenced. The yarn's moisture content is played a significant role in concluding its control and suitability for optimum result in down stream processing.
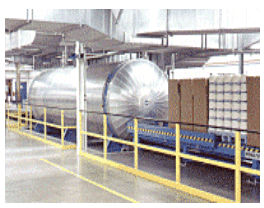
Currently, few yarn-conditioning machines are obtainable commercially, which applied the modern technology to arrange the yarn up to its base. It is stated that the conditioning of cotton yarns by these machines gives up to 10 percent higher strength, 30 percent higher elongation, 40 percent less lint and fiber fly and are independent from electrostatics problems. Also, comforting with steam removes kinking and snarling throughout the unwinding process.
This conditioning process widens its competencies in all successive functions such as winding, twisting, warping, weaving and knitting. These yarns conditioning plants applies technology based on saturated steam, which at low temperature is efficiently water set to reduce immediately on contact with any material mass.
The technology is focused on an autoclave designed to allow total standardized penetration of steam during the yarn packages. The process comprises the cones being heated by the condensing measures of the steam on to the fibers; this so named 'air washing' method commencing the required minute quantity of moisture to be circulated fully and uniformly throughout the total mass of the yarn. The vacuum of the autoclave is so planned as to keep away from the drawbacks of the traditional autoclaves which are liable to impair yarn quality; make sure that no air bubbles are trapped within the bobbins and also removes the risk of splashing of water droplets which generate options for a spoiling biochemical reaction that produces 'mushrooms' or other micro organisms to built up on the package surface.
After conditioning, while a majority of the quality factors get well, there is a clear increase in imperfection values provided by capacitance type evenness testers. The increment in yarn imperfections normally occurs because of mechanical processing - mainly rubbing of yarn on any peripheral surface. Throughout conditioning, this does not acquire. Therefore, a study has been undertaken to recognize the same and to have a solution to the problem of increased imperfections.
Approach and Resources
Collection from 20s to 100s and physical properties under four situations (A, B, C and D) were considered in eight different counts. All 32 combinations have been used in the study. The process factors of the yarn conditioning plants were kept as per the normal conditions followed by the spinning mills (Table 1).
Collection from 20s to 100s and physical properties under four situations (A, B, C and D) were considered in eight different counts. All 32 combinations have been used in the study. The process factors of the yarn conditioning plants were kept as per the normal conditions followed by the spinning mills (Table 1).
Before
and after steam conditioning, the yarns were checked through single
yarn strength testers, capacitance type evenness testers (Premier PT4
and Uster UT4) and Lawson Hemphill Electronics Inspection Board (EIB).
By applying image analysis system, the EIB recognizes the thin places,
thick places and NEPs. All these tests were once more carried out after
conditioning the steam cord yarns for 24 hours and 48 hours. Single yarn
strength, elongation at break, CV percent of strength, elongation, yarn
hairiness, etc yarn properties have been reviewed. The snarling
movement has been characterized by the term Snarling Index. The yarns
were knitted and the fabric look was evaluated by applying subjective
method.
Results and analysis
The values have been measured before conditioning, just conditioning (after keeping sample for 24 hours and 48 hours in a laboratory where ambient conditions), the physical properties of yarn are kept at 27(with consideration of variation of 2 degree Celsius) degree Celsius and 65 percent (with consideration variation of 2 percent) relative humidity, which is showed in Tables, 2, 3 & 4.
The values have been measured before conditioning, just conditioning (after keeping sample for 24 hours and 48 hours in a laboratory where ambient conditions), the physical properties of yarn are kept at 27(with consideration of variation of 2 degree Celsius) degree Celsius and 65 percent (with consideration variation of 2 percent) relative humidity, which is showed in Tables, 2, 3 & 4.
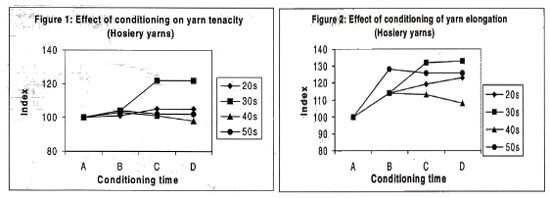
It
can be observed from Tables 2, 3 & 4 that, commonly, just after
conditioning for both hosiery and warp yarns, there observed an upsurge
in yarn tenacity and elongation at break values. For both hosiery and
warp yarns, the increase in tenacity after conditioning is observed at
the similar rate (2-5 percent), but there is significant improvement in
elongation for hosiery yarns (15-20 percent) in against to warp yarns
(8-10 percent). This may be because of superior dispersion of water
molecules inside the yarn core for hosiery calculation as these yarns at
low TM. It is noted that for cotton, its strength increases as the
moisture level increases. The steam conditioning raises the moisture
level in the yarns giving the rise in yarn tenacity. The yarns, which
can soak up moisture, reveal a superior elongation with increasing
relative humidity.
Increased
yarn elongation observed after steam conditioning as the increment in
moisture level in cotton yarn. In the laboratory, after holding the yarn
samples open for 24 hours and 48 hours, the disparity someway
decreased. Though, even after 48 hours the yarn tenacity values and
elongation at break values were increased against unconditioned yarns.
The same drift is noted for hosiery and warp yarns (Figures 1 & 2).
In
some cases, there seems a decrement in RKM CV percent value and
Elongation CV percent value after conditioning, which continued after 48
hours also. This observable fact can gives in less yarn breakages in
further procedure such as warping and weaving. After conditioning, the
yarn hairiness has decreased slightly on an average 2-5 percent for both
hosiery and warp yarns. The decrement is observed in case of finer
yarns such as 40s, 50s etc. As finer fibers are applied to make these
yarns, the surface fibers might get stick on to the surface because of
suction throughout conditioning process. It can also be seen that the
deficiency have increased significantly after conditioning to the tune
of 35-40 percent as against to unconditioned yarns for knitting as well
as warp yarns and decreased to some level after the yarns were kept in
the laboratory for 24 hours and 48 hours (Figure 3).
Though, for nearly all counts (20s-60s), as against to the parent yarn, the deficiency still kept at a higher level. It is noted that capacitance type sensors are very much responsive to moisture content in the material under test. There seem some changes in moisture content in different parts of yarn, after steam conditioning, which might have influenced the deficiency values. Same yarns are being measured by Lawson Hemphill Electronic Inspection Board (EIB), which calculated the yarn weakness by applying Image Analysis technique. The moisture level of the yarn does not affected by this method. Also the changes in mass per unit length and the changes in yarn diameter are not similar at each and every task. The observations are shown in Tables 5 and 6. The situation were kept at same level as Capacitance tester, i.e., thin places (-50 percent), thick places (+50 percent) and Neps (+200 percent) for normal imperfections and thin places (-40 percent), thin places (+35 percent) and neps (+140 percent) for extra-sensitive imperfections.
The
observations in Tables 5 and 6 reveals that unlike capacitance type
tester results, there is no understandable tendency of increase in
deficiency after conditioning when it noted by applying Optical Method.
The values are noted either almost same or at a reduced amount after
conditioning as compared to before conditioning results and it noted in
most of the cases.
One of the aims of steam conditioning is to establish the distortion of the high twist yarn. This is prepared to decrease snarling drift of the yarn while processing it further. The affect of steam conditioning on snarling drift is observed in Table 7. At cop stage and later on at cone stage, the yarn was conditioned.
One of the aims of steam conditioning is to establish the distortion of the high twist yarn. This is prepared to decrease snarling drift of the yarn while processing it further. The affect of steam conditioning on snarling drift is observed in Table 7. At cop stage and later on at cone stage, the yarn was conditioned.
It
can be observed from the table that there is a little decrement seen in
Snarling Index after conditioning at cop stage, and conditioning at
cone stage has gave a further decrement. In compared to the earlier
experiments, no variation in hairiness values was seen after
conditioning. This may be because of extra binding of short fibers,
ensuing from high twist. Inserting high twist itself might have gained
the maximum value. Therefore, no improvement in yarn hairiness could be
observed further while conditioning process.
To make four sets of knitted fabrics, four sets of yarns (2 Hosiery and 2 Warp yarns) were applied. The yarns having no conditioning and after conditioning were applied for knitting. The fabrics were named as 1A, 1B, 2A, 2B, 3A, 3B and 4A, 4B where A specifies after conditioning and B specifies without conditioning. These fabrics were measured for looks by applying subjective technique occupying 10 independent judges. The judges were invited to compare A and B of each number and grade them as either, A better than B, A equal, to B or B better than A. The observations are drawn in Table-8.
To make four sets of knitted fabrics, four sets of yarns (2 Hosiery and 2 Warp yarns) were applied. The yarns having no conditioning and after conditioning were applied for knitting. The fabrics were named as 1A, 1B, 2A, 2B, 3A, 3B and 4A, 4B where A specifies after conditioning and B specifies without conditioning. These fabrics were measured for looks by applying subjective technique occupying 10 independent judges. The judges were invited to compare A and B of each number and grade them as either, A better than B, A equal, to B or B better than A. The observations are drawn in Table-8.
It can be observed from Table 8 that 70 percent of decision directed to "A is better than B" and on 20 percent directed to "B is better than A". Therefore, it can be analyzed that 80 percent of results directed that the looks of the fabric knitted applying steam conditioned yarn is either better than or same as the looks of the fabric produced of unconditioned yarn. This explains that the conditioning of the yarn has not declined the actual yarn looks, but only has enhanced the same. This may be because of 'laying of' some of the hairs on the surface of the yarn.
Conclusion
For both hosiery and warp yarns, the yarn tenacity strengthen after conditioning by 2-5 percent and the elongation at break strengthen by 8-20 percent. In the case of hosiery yarns than warp yarns, the increment in elongation is further observed changes in its value almost 5 times more.
There observed a decrement in yarn hairiness by 2-5 percent and 11-18 percent for both hosiery and warp yarns just after conditioning and 48 Hrs of yarn conditioning in that order.
The observed deficiency values by applying capacitance type testers, increased after steam conditioning of yarns by 35- 40 percent for both hosiery and warp yarns. The conditioning of yarn samples in laboratory condition reduces the gap, but deficiency still stayed at a higher level, on an average 40 percent and 6 percent for hosiery and warp counts correspondingly in against the parent yarn. The snarling drift of yarns decreases because of steam conditioning by 10-20 percent.
In most of the cases, the deficiency values observed by optical type tester in which do not observed rise after conditioning. The moisture does not affect the image analysis technique applied by the optical type tester and observed similar. This proves that the looks of the yarn has not been weaken after conditioning. The looks of the fabrics made from steam conditioned yarns are superior to the fabrics made from unconditioned yarns which prove that there is no decline in yarn and fabric looks after steam conditioning.