Maintenance Tools & Techniques
Not
every maintenance tool fits on a tool belt, and not every maintenance
tool is designed
for repairing assets. O+ther tools exist that help
maintenance teams improve things beyond
physical assets. For instance,
various types of analyses are used to gather insights about
why and when
assets fail. And standards, regulations, and other documentation exist
to
keep maintenance teams organized and compliant.
Using these maintenance tools will help you build an environment in which proactive
maintenance and precision maintenance can thrive.
Analysis
P-F Curve
A
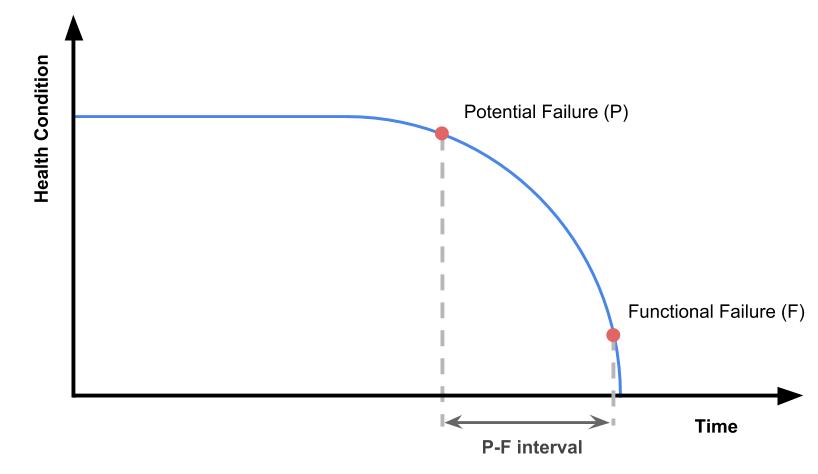
P-F curve is a graph that shows the health of equipment over time to
identify the
interval between potential failure and functional failure.
P-F Curve
What is a P-F curve?
A P-F curve is a graph that shows the health of equipment over time to identify theinterval between potential failure and functional failure.
Overview
The eventual failure of any equipment is inevitable. Wear and tear naturally occur withcontinual usage. In the same way your pair of shoes
eventually get worn out after
500 miles of walking, your key plant
equipment (e.g. pumps, motor bearings)
will ultimately reach its
functional failure point.
The good news is that the functional failure point (i.e. the end of equipment life) takes
The good news is that the functional failure point (i.e. the end of equipment life) takes
a long time to
occur. The P-F curve helps to characterize the behavior of equipment
over time. Its used to assess the maximum usage that can be gained from
the equipment.
Potential failure and functional failure
There are two main points of the P-F curve that need to be identified.- Potential failure indicates the point at which we notice that equipment is starting to deteriorate and fail.
- Functional failure is the point at which equipment has reached its useful limit and is no longer operational.
is initially noticed and when the equipment fails completely.
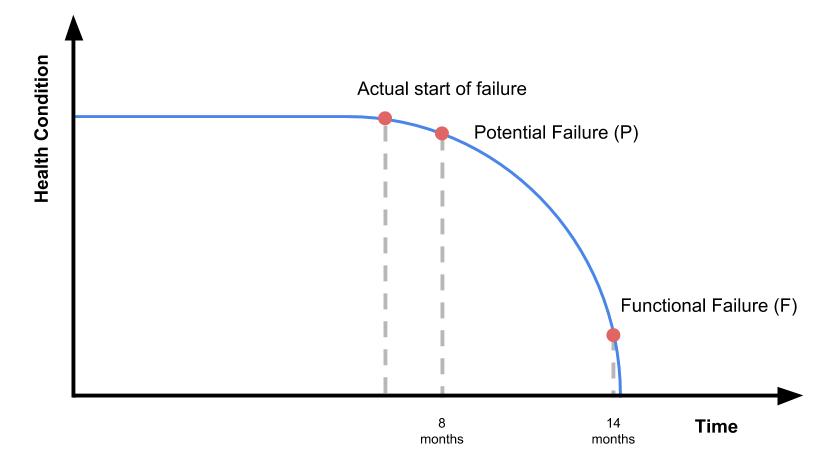
For example, assume that a pump that’s been normally operating for eight months suddenly produces more noise than usual. Unnecessary noise can be a sign of failure. With the inspection and confirmation of maintenance personnel, we can then say that the first noticed sign of failure (i.e. the potential failure point) occurred at eight months.
Note that the actual start of deterioration might have happened before the eight-month mark. So we can assume that the actual start of failure happened some time before point P. However, it is only the potential point of failure that we can measure in time with certainty as it was the first event when noticeable symptoms of failure were recorded.
For the same example, we can suppose that the pump continues to operate for another six months until it totally breaks down—that is the functional failure point at 14 months.
Common practice is to maximize the use of the P-F curve with condition-based maintenance (CBM). By applying CBM and proactively checking the condition of the equipment, we are able to infer the rate of deterioration over time. Maintenance personnel are then able to plan and assess whether it is cost-efficient to mitigate the causes of failure given the projected P-F interval.
How to create a P-F curve
The basic parts of the P-F curve are given above. Actual data can be expected to vary on a case to case basis. For instance, the lifespan of a heavy duty pump might not be the same as that of a mechanical bandsaw. It then follows that expected failure points for different equipment will vary. Care must be considered when building P-F curves. Different types of equipment are expected to have varying interval values.For example, assume that a pump that’s been normally operating for eight months suddenly produces more noise than usual. Unnecessary noise can be a sign of failure. With the inspection and confirmation of maintenance personnel, we can then say that the first noticed sign of failure (i.e. the potential failure point) occurred at eight months.
Note that the actual start of deterioration might have happened before the eight-month mark. So we can assume that the actual start of failure happened some time before point P. However, it is only the potential point of failure that we can measure in time with certainty as it was the first event when noticeable symptoms of failure were recorded.
For the same example, we can suppose that the pump continues to operate for another six months until it totally breaks down—that is the functional failure point at 14 months.
How to maximize the P-F curve
Now that we’ve visualized how the P-F curve relates to real-life scenarios, we have the chance to prepare for the inevitable functional failure. The idea is to balance our resources to prolong the P-F interval economically.Common practice is to maximize the use of the P-F curve with condition-based maintenance (CBM). By applying CBM and proactively checking the condition of the equipment, we are able to infer the rate of deterioration over time. Maintenance personnel are then able to plan and assess whether it is cost-efficient to mitigate the causes of failure given the projected P-F interval.
The P-F curve and CBM
At the early signs of failure, it may be helpful to perform routine CBM tasks to assess the health of the equipment.Continuing with our pump example, a P-F curve coupled with CBM tasks to monitor pressure and flow rate conditions may resemble the following graph:
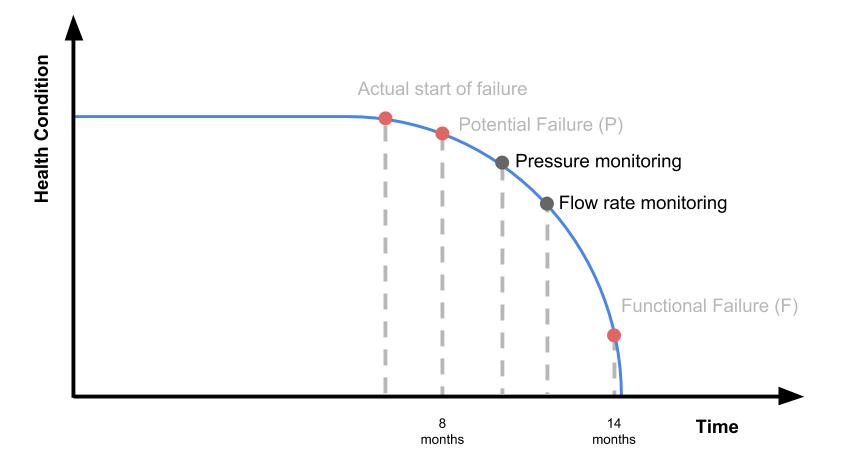
A maintenance team can attach condition monitoring sensors to the equipment after the point of
- potential failure to assess how much more the equipment can be maximized.
FMEA
Failure
Mode and Effects Analysis (FMEA) is a process that is available to
organizations to identify
potential failures with assets and other areas
of business.
FMEA is the
systematic process to evaluate failure modes, causes associated with
failures and the
effect of such failures. The cross functional core
committee needs to identify known and potential
areas of failure and the
root-causes of such failure through why–why analysis. Brainstorming
through small group activities may be carried out involving the
frontline supervisors and even
operators. The failure modes can be
prioritised by assigning Risk Priority Number (RPN), which
is a product
of occurrence (frequency of failure O), severity (seriousness of the
failures S) and
detection (ability to detect the failure D).
RPN = O x S x D
Details of the failure analysis need to be documented.
Acronym for Failure Modes and Effects Analysis. FMEA is a risk
assessment tool, that evaluates the RPN = O x S x D
Details of the failure analysis need to be documented.
severity, occurrence and detection
of risks to prioritize which ones are the most urgent. The two most
popular types of FMEAs are Process (PFMEA) and Design (DFMEA).
Each category has a scoring matrix with a 1-10 scale.


After scoring of each category is complete for each risk, the three scores are multiplied together
Each category has a scoring matrix with a 1-10 scale.
- Severity of 1 denotes low risk to the end customer, & a score of 10 denotes high risk to the customer.
- Occurrence of 1 denotes low probability of the risk happening, and a 10 denotes a very high probability of the risk happening.
- Detection of 1 denotes a process that WILL likely catch a failure, and a 10 means the process will likely NOT catch a failure.
After scoring of each category is complete for each risk, the three scores are multiplied together
(Severity x Occurrence x Detection) to
determine the Risk Priority Number (RPN). The RPNs
are sorted from largest to smallest, and actions are taken on the top risks in order to reduce the
overall risk.


Typically, the severity cannot be reduced, so the team should
evaluate ways to reduce occurrence
or increase detection. After actions
are completed, the RPNs are recalculated and new risks
are determined.
Root Cause Analysis
Root cause analysis (RCA) is a systematic process of identifying the origin of an incident.
Next to defining a problem
accurately, root cause analysis is one of the most important elements of
problem-solving in quality management. That’s because if you’re not aiming at
the right target,
you’ll never be able to eliminate the real problem that’s
hurting quality.
So which type of root cause analysis
tool is the best one to use? Manufacturers have a range of methods
at their
fingertips, each of which is appropriate for different situations. Below we
discuss five common
root cause analysis tools, including:
- Pareto Chart
- The 5 Whys
- Fishbone Diagram
- Scatter Diagram
- Failure Mode and Effects Analysis (FMEA)
1.
Pareto Chart
A Pareto chart is a histogram or bar
chart combined with a line graph that groups the frequency or
cost of different
problems to show their relative significance. The bars show frequency in
descending order,
while the line shows cumulative percentage or total as you
move from left to right.
The Pareto chart example above is a
report from layered process audit software that groups
together the top
seven categories of failed audit questions for a given
facility. Layered process audits (LPAs) allow you to
check high-risk processes
daily to verify conformance to standards. LPAs identify process variations that
cause defects, making Pareto charts a powerful reporting tool for analyzing LPA
findings.
Pareto charts are one of the seven
basic tools of quality described by quality pioneer Joseph Juran.
Pareto charts
are based on Pareto’s law, also called the 80/20 rule, which says that 20% of inputs
drive
80% of results.
2.
5 Whys
The 5 Whys is a method that uses a
series of questions to drill down into successive layers of a problem.
The
basic idea is that each time you ask why, the answer becomes the basis of the
next why.
It’s a simple tool useful for problems where you don’t need advanced
statistics, so you don’t necessarily
want to use it for complex problems.
One application of this technique is
to more deeply analyze the results of a Pareto analysis.
Here’s an example of
how to use the 5 Whys:
Problem: Final assembly time exceeds
target
- Why is downtime in final assembly higher than our goal? According to the Pareto chart, the biggest factor is operators needing to constantly adjust Machine A
- Why do operators need to constantly adjust Machine A? Because it keeps having alignment problems
- Why does Machine A keep having alignment problems? Because the seals are worn
- Why are Machine A’s seals worn? Because they aren’t being replaced as part of our preventive maintenance program
- Why aren’t they being replaced as part of our preventive maintenance program? Because seal replacement wasn’t captured in the needs assessment
Of course, it may take asking why
more than five times to solve the problem—
the point is to peel away
surface-level issues to get to the root cause.
3.
Fishbone Diagram
A fishbone diagram sorts possible
causes into various categories that branch off from the original problem.
Also
called a cause-and-effect or Ishakawa diagram, a fishbone diagram may have
multiple sub-causes
branching off of each identified category.
4.
Scatter Plot Diagram
A scatter plot or scatter diagram
uses pairs of data points to help uncover relationships between variables.
A
scatter plot is a quantitative method for determining whether two variables are
correlated, such as
testing potential causes identified in your fishbone
diagram.
Making a scatter diagram is as
simple as plotting your independent variable (or suspected cause)
on the
x-axis, and your dependent variable (the effect) on the y-axis. If the pattern
shows a clear line
or curve, you know the variables are correlated and you can
proceed to regression or correlation analysis.
5.
Failure Mode and Effects Analysis (FMEA)
Failure mode and effects analysis
(FMEA) is a method used during product or process design to
explore potential
defects or failures. An FMEA chart outlines:
- Potential failures, consequences and causes
- Current controls to prevent each type of failure
(RPN) for
determining further action
Lean Six Sigma
Lean Six Sigma is a process that aims to systematically eliminate waste and reduce variation.
SCADA System
Supervisory control and data acquisition (SCADA) systems are a computer system used to monitor
and control plant processes.
SCADA
Supervisory control and data acquisition (SCADA) is a system of software and hardware elementsthat allows industrial organizations to:
- Control industrial processes locally or at remote locations
- Monitor, gather, and process real-time data
- Directly interact with devices such as sensors, valves, pumps, motors, and more through human-machine interface (HMI) software
- Record events into a log file
process data for smarter decisions,
and communicate system issues to help mitigate downtime.
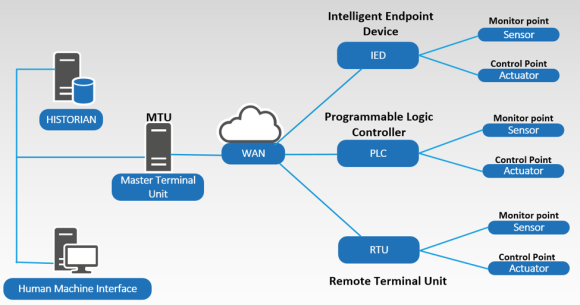
The basic SCADA architecture begins with programmable logic controllers (PLCs) or remote terminal
The basic SCADA architecture begins with programmable logic controllers (PLCs) or remote terminal
units (RTUs). PLCs and RTUs are
microcomputers that communicate with an array of objects such as
factory
machines, HMIs, sensors, and end devices, and then route the
information from those objects
to computers with SCADA software. The
SCADA software processes, distributes, and displays the
data, helping
operators and other employees analyze the data and make important
decisions.
For example, the SCADA system quickly notifies an operator that a batch of product is showing
For example, the SCADA system quickly notifies an operator that a batch of product is showing
a high incidence of errors. The operator
pauses the operation and views the SCADA system data via
an HMI to
determine the cause of the issue. The operator reviews the data and
discovers
that Machine 4 was malfunctioning. The SCADA system’s ability
to notify the operator of an issue
helps him to resolve it and prevent
further loss of product.
Planned Maintenance Optimization
Planned
Maintenance Optimization (PMO) is a method of improving maintenance
strategies based
on existing preventive maintenance (PM) routines and
available failure history.
What is planned maintenance optimization?
Planned Maintenance Optimization (PMO) is a method of improving maintenance strategies basedon existing preventive maintenance (PM) routines and
available failure history.
Overview
While most companies have identified the need for a preventive maintenance (PM) program,the effective execution of such maintenance activities can be
challenging given the everyday demands
of a facility. Unseen
circumstances that require urgent attention can easily derail planned
activities
and can potentially disrupt a smoothly running plant.
While alternatives such as reliability centered maintenance (RCM) addresses some of the factors
While alternatives such as reliability centered maintenance (RCM) addresses some of the factors
that make PM a cost- and labor-intensive
process, coming up with a robust RCM strategy may
take long periods of
time.
PMO provides a method through which maintenance activities are carried out more efficiently.
PMO provides a method through which maintenance activities are carried out more efficiently.
By performing PMO, a new maintenance
strategy is derived from existing PM tasks.
Given the existing tasks,
modifications on the schedule and frequency of the routines are done
based
on the failure history of the equipment. With a relatively shorter
time to develop, the resulting
strategy can be similar to performing
RCM.
The three phases of PMO
The PMO process can be summarized in three phases:Data collection
Any attempt at optimization starts with good, reliable data. Data on equipment performance,particularly on failure history over time, must
be collected. A minimum time period must be set to
ensure that enough
insight is obtained from the data. Tools such as a CMMS program can make
this process easier and more accurate.
Data analysis, review, and recommendations
The collected data must be analyzed to identify which equipment is the most critical. Some points toconsider are criticality to the plant’s
operations, cost to repair, MTBF, and MTR.
The information gathered from analyzing the data must then be reviewed against existing PM routines.
The information gathered from analyzing the data must then be reviewed against existing PM routines.
Some key points to review are: 1) whether
the PM routines are scheduled correctly to align with the
MTBF and MTR
data points, and 2) whether failure points are within acceptable
tolerances set by
original equipment manufacturer (OEM) specifications
or industry standards. Any substantial deviations
from such checks can
be a source of improvement from a maintenance standpoint.
Based on the review, recommendations on modifications for the PM tasks should be made. Schedules
Based on the review, recommendations on modifications for the PM tasks should be made. Schedules
and frequencies of activities need to be optimized to
meet MTBF and MTR constraints. Any missing
maintenance activities, as
well as redundancies in tasks, need to be addressed accordingly.
Agreement and execution
Agreed action items must be delegated properly. Identified task owners should be accountable for anyrequired action and monitored for progress. Note
that the PMO process is a continuous effort and
reviews should be done
habitually.
Benefits of applying PMO
Regular maintenance activities are clearly a key part in ensuring a plant’s reliability. But PMO furtherincreases the benefits of maintenance activities by showing
substantial reductions in costs.
In the laboratory and life sciences industry, a PMO program is estimated to reduce overall maintenance
In the laboratory and life sciences industry, a PMO program is estimated to reduce overall maintenance
costs by around 25%.
Payback periods of investing in a PMO strategy are estimated at around
12 to 24 months, just considering the measured savings from maintenance
costs.
Aside from the improvements in uptime and reliability that come with a robust maintenance strategy,
Aside from the improvements in uptime and reliability that come with a robust maintenance strategy,
PMO methods enable company
resources to be spent more wisely without sacrificing the quality
of
execution of maintenance tasks.
Conclusion
Maintenance activities, particularly PM activities, are already proven concepts that increase theoverall performance of a plant. With continuous practice,
PMO is a tool that can help execute
PM activities more efficiently and
effectively.
Standards
ISO 55000
To
comply with ISO 55000 you must have an asset management system.
The
goal of an asset management system is to establish the policies,
objectives, and processes needed
to achieve an organization’s goals.
ISO 55001
The
components of an asset management system that are listed out in ISO
55000 are elaborated on
in ISO 55001. These components include
organizational context, leadership, planning, support,
operation,
performance evaluation, and improvement.
ISO 55002
ISO 55002 provides the most significant details needed to achieve compliance with ISO 55000.
SAE JA1011
SAE
JA1011 was initially developed by the commercial aviation industry to
improve the safety
and reliability of their equipment.
Because of this,
it’s known as a Reliability-Centered Maintenance (RCM) process.
Regulations
FDA Maintenance Regulations
FDA
inspections are typically conducted by reviewing systems which
correspond to the Subparts
that are applicable to the type of
product/facility being audited. In the case of maintenance,
Subparts for
Buildings and Facilities and Equipment are of the main concern.
OSHA Maintenance Regulations
Maintenance
workers are among the many workers that are exposed to workplace
hazards on a daily
basis. OSHA aims to protect them by providing access
to information for vulnerable workers in
high-risk jobs.
IRS Maintenance Regulations
There
are specific deductible and capital improvement costs that are directly
related to maintenance
operations and the IRS provides information
about how it allows businesses to recover those costs.
Documents
Equipment Maintenance Log
An equipment maintenance log is a document that records activities that have been performed on an asset.
Operation and Maintenance Manual
An
operation and maintenance manual is a comprehensive document that
provides all the details
necessary about a physical plant as well as
individual pieces of equipment to help the
maintenance staff keep
everything running smoothly.